Dependency Graph
You can view the topology of deployed resources through the dependency graph. Walrus provides dependency graphs at two levels: environment and resource.
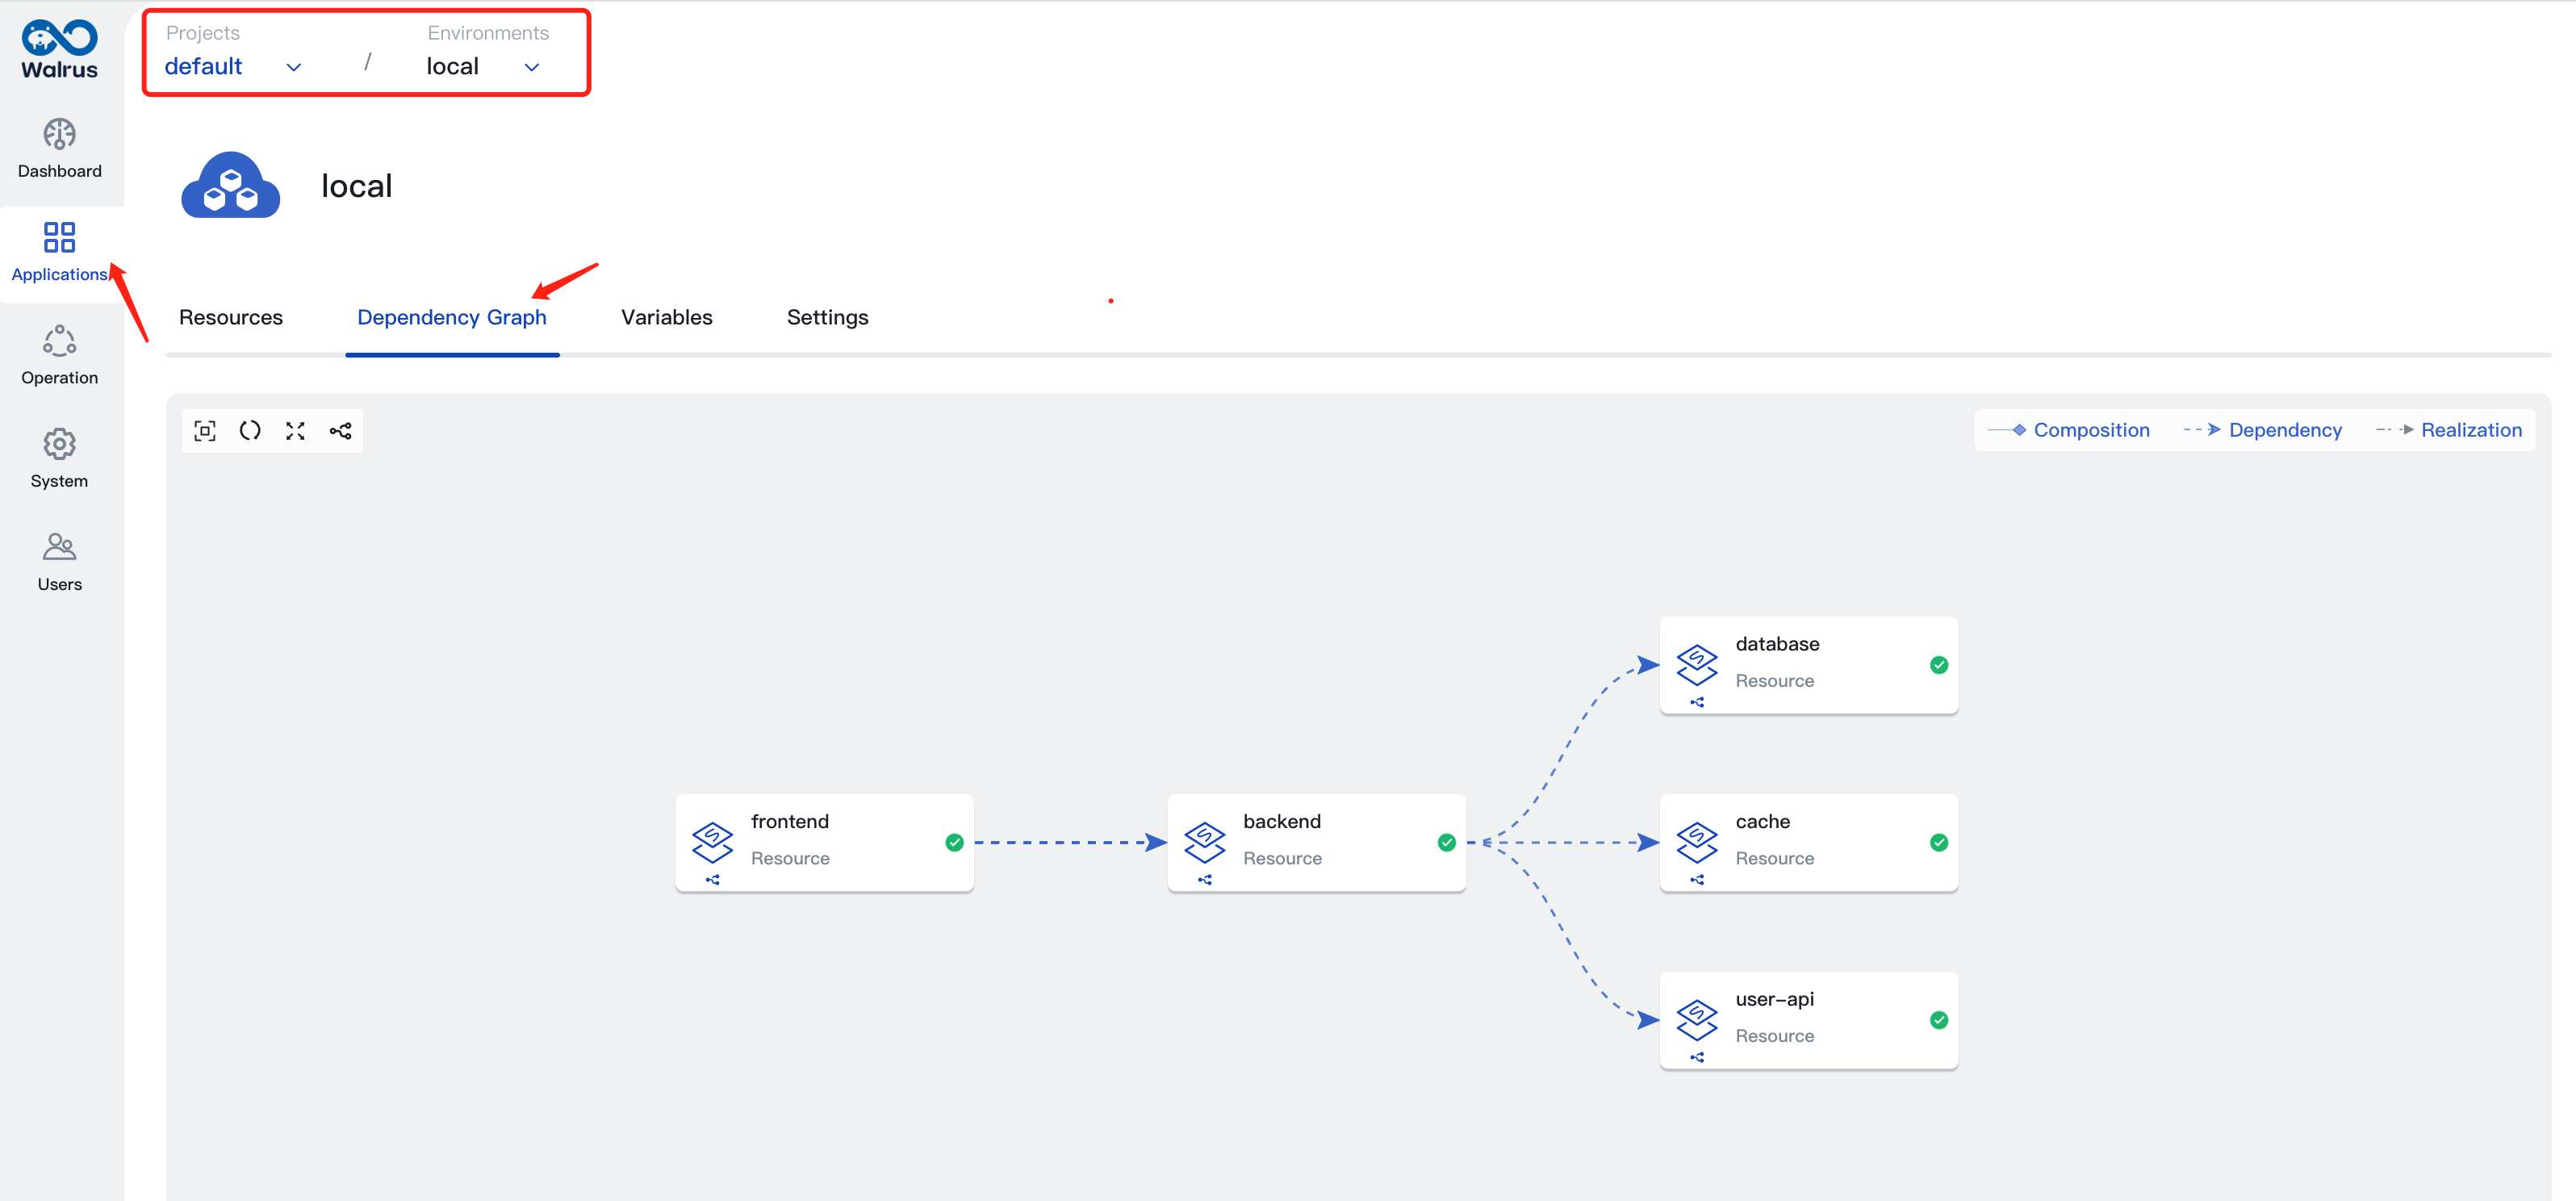
Environment Dependency Graph
The environment dependency graph includes all resources in the environment, as well as their relationships and deployment status.
- Click
Applicationsin the left navigation bar to enter the project and environment. - Click the
Dependency Graphtab to view the environment dependency graph.
Note: In the dependency graph, sub-nodes that are "implemented" and "inherited" are hidden by default. They can be expanded by clicking on the "Show Sub-resources" icon in the toolbar.
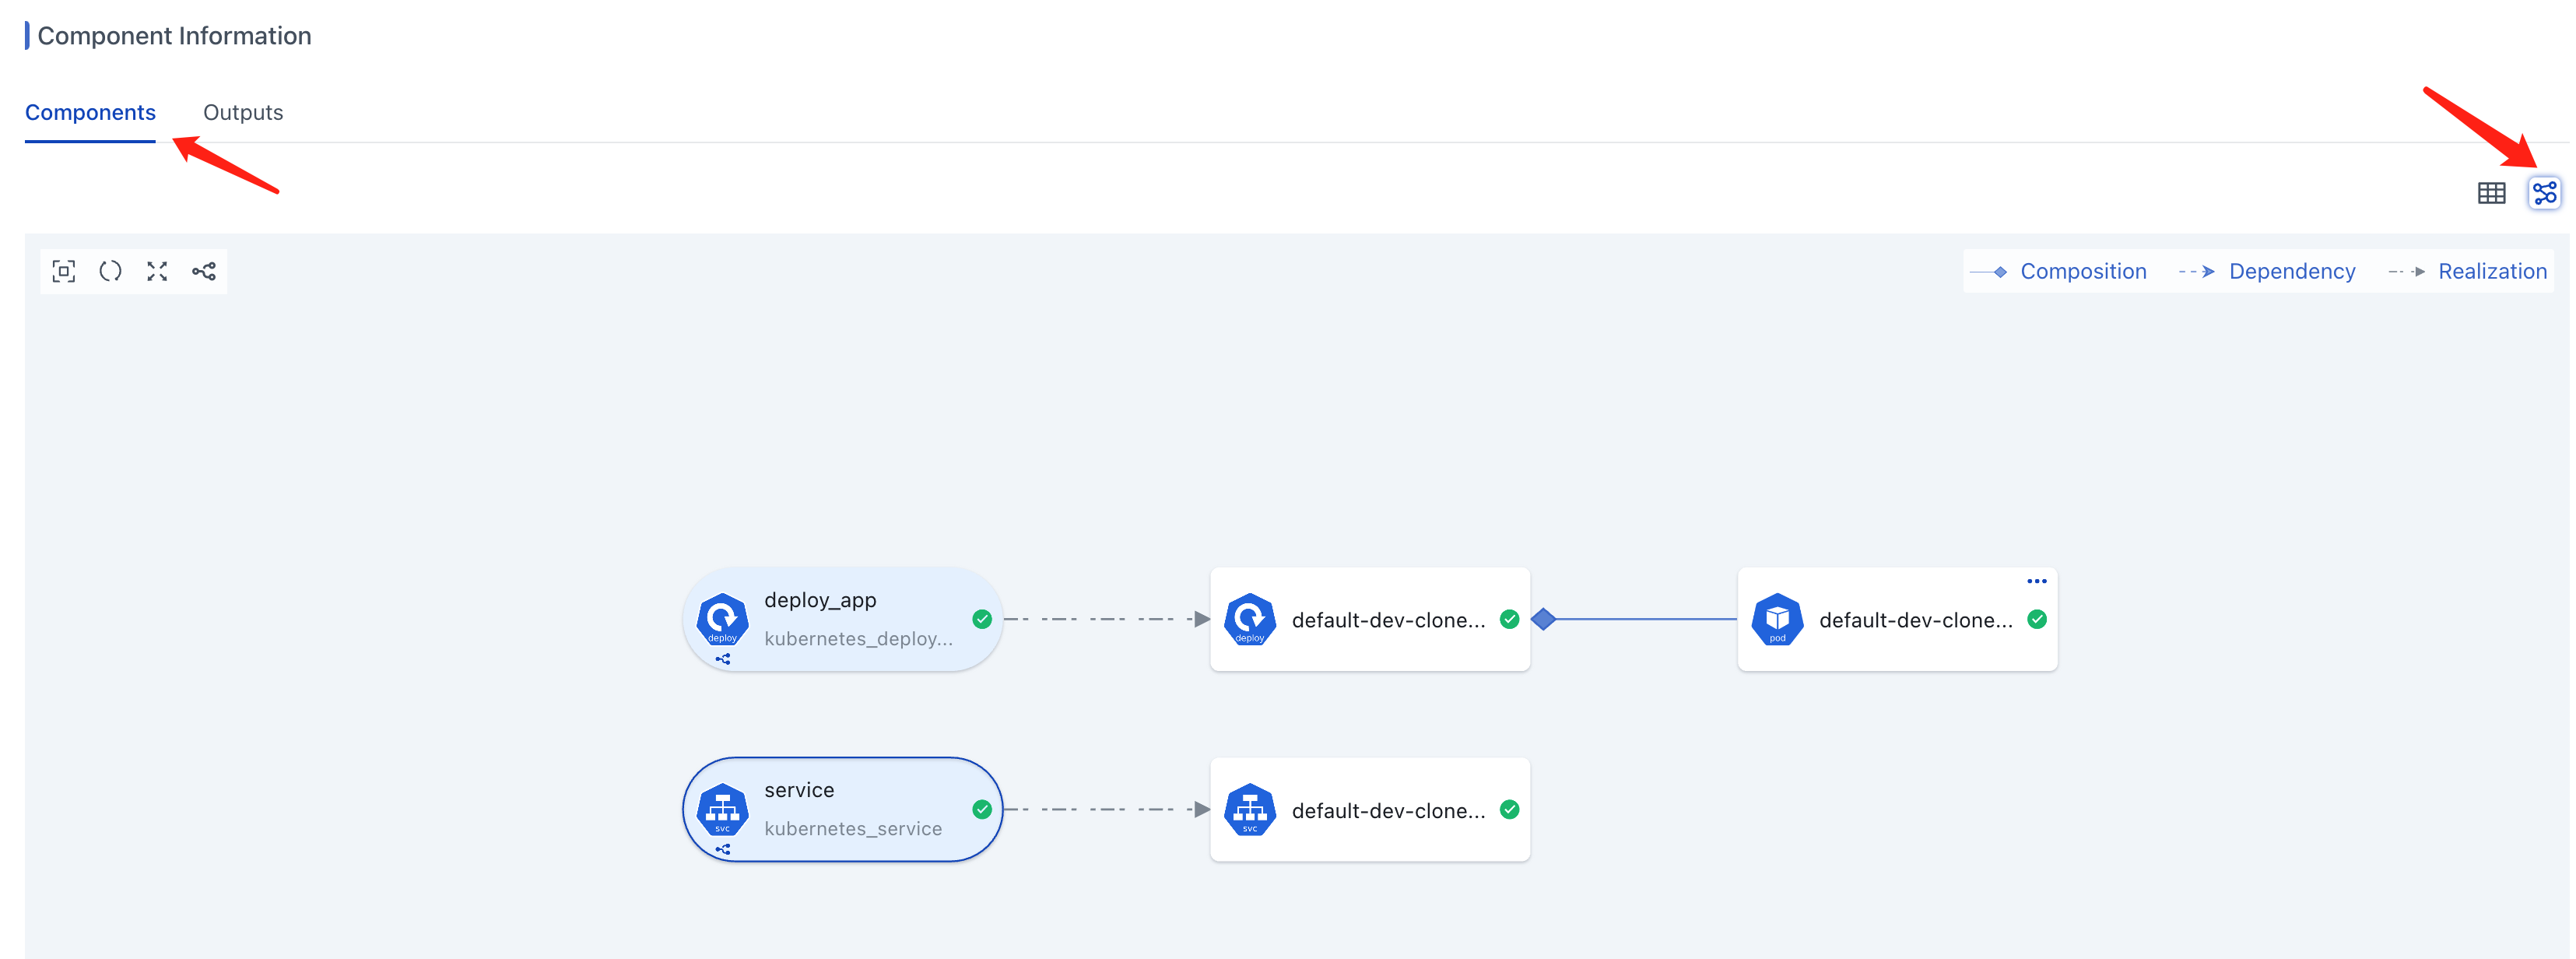
Resource Dependency Graph
The resource dependency graph displays all components under the resource, as well as their relationships and deployment status.
- Click
Applicationsin the left navigation bar, enter the project and environment, and go to the resource detail page. - Under the
Componentstab of component information, click the icon on the right to switch to the graph view.
Dependency Graph Node Relations
The relationships between nodes in the dependency graph can be divided into three categories:
- Composition: A component relationship, represented by a solid line and a diamond arrow
- Dependency: Denotes dependency, represented by a dashed line and a V-shaped arrow
- Realization: Realization or inheritance, represented by a dotted line and a triangular arrow

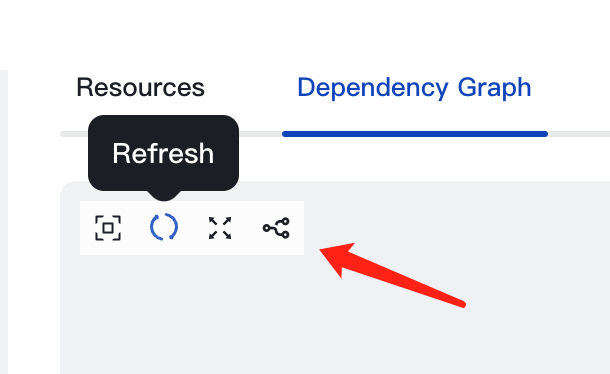
Graph Toolbar
- Fit View: Adjusts the zoom or position to ensure the entire content fits within the current view.
- Refresh: Refresh the view.
- Full Screen: View in full screen.
- Show Components: Toggle display or hide components of resources.
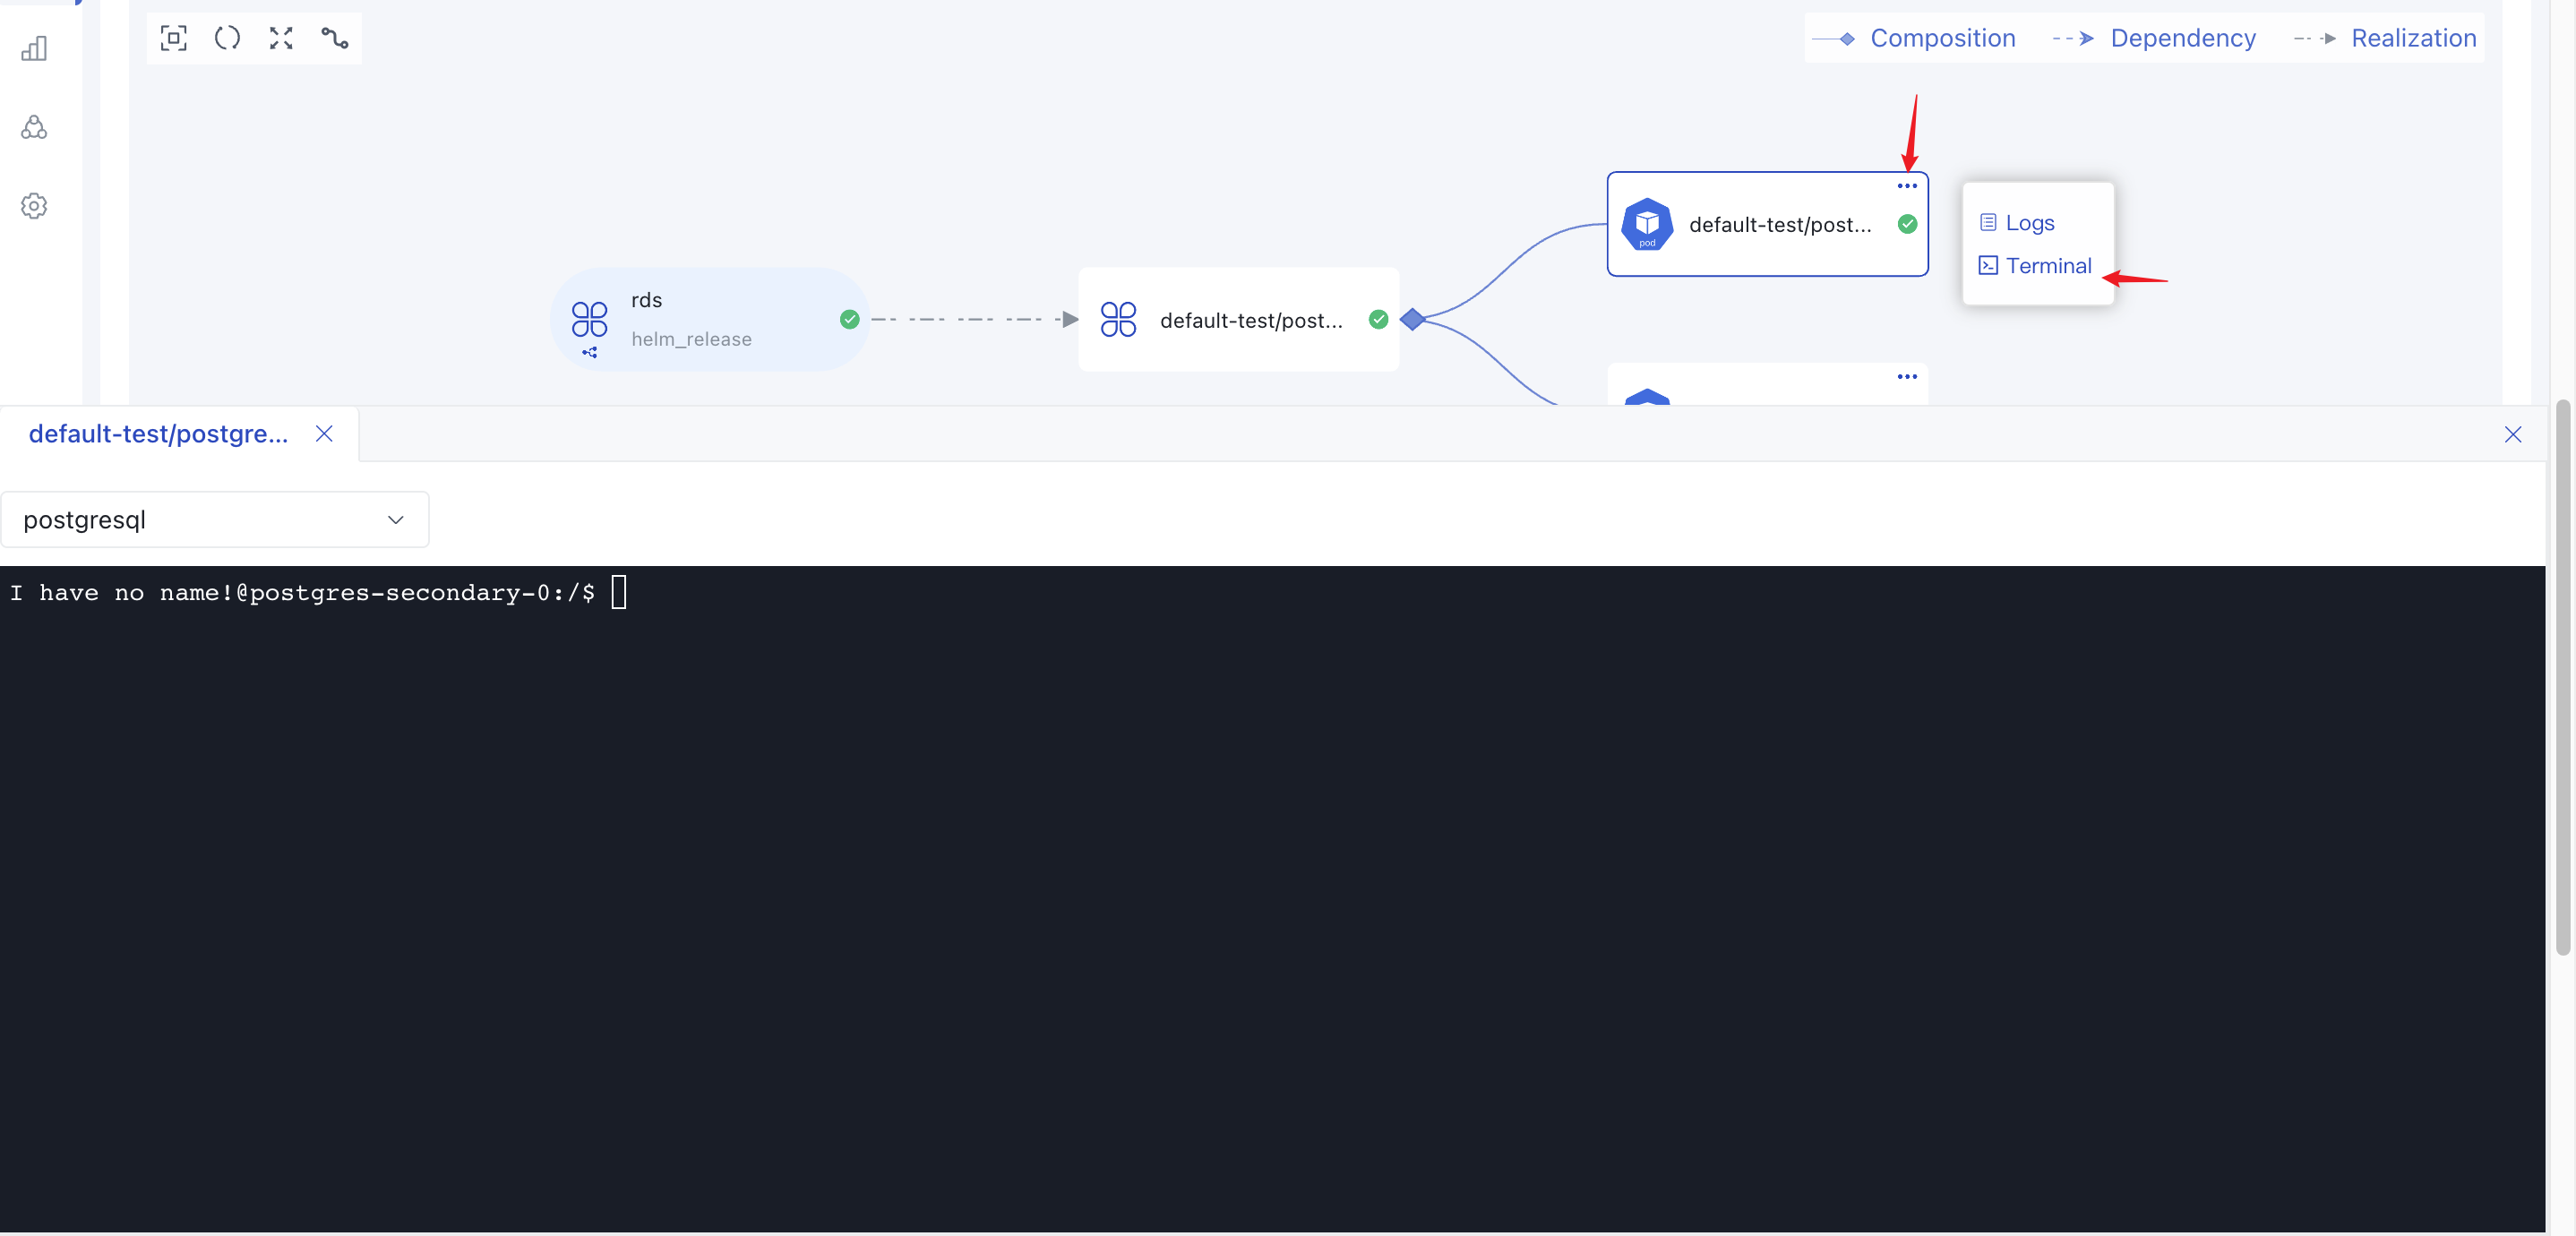
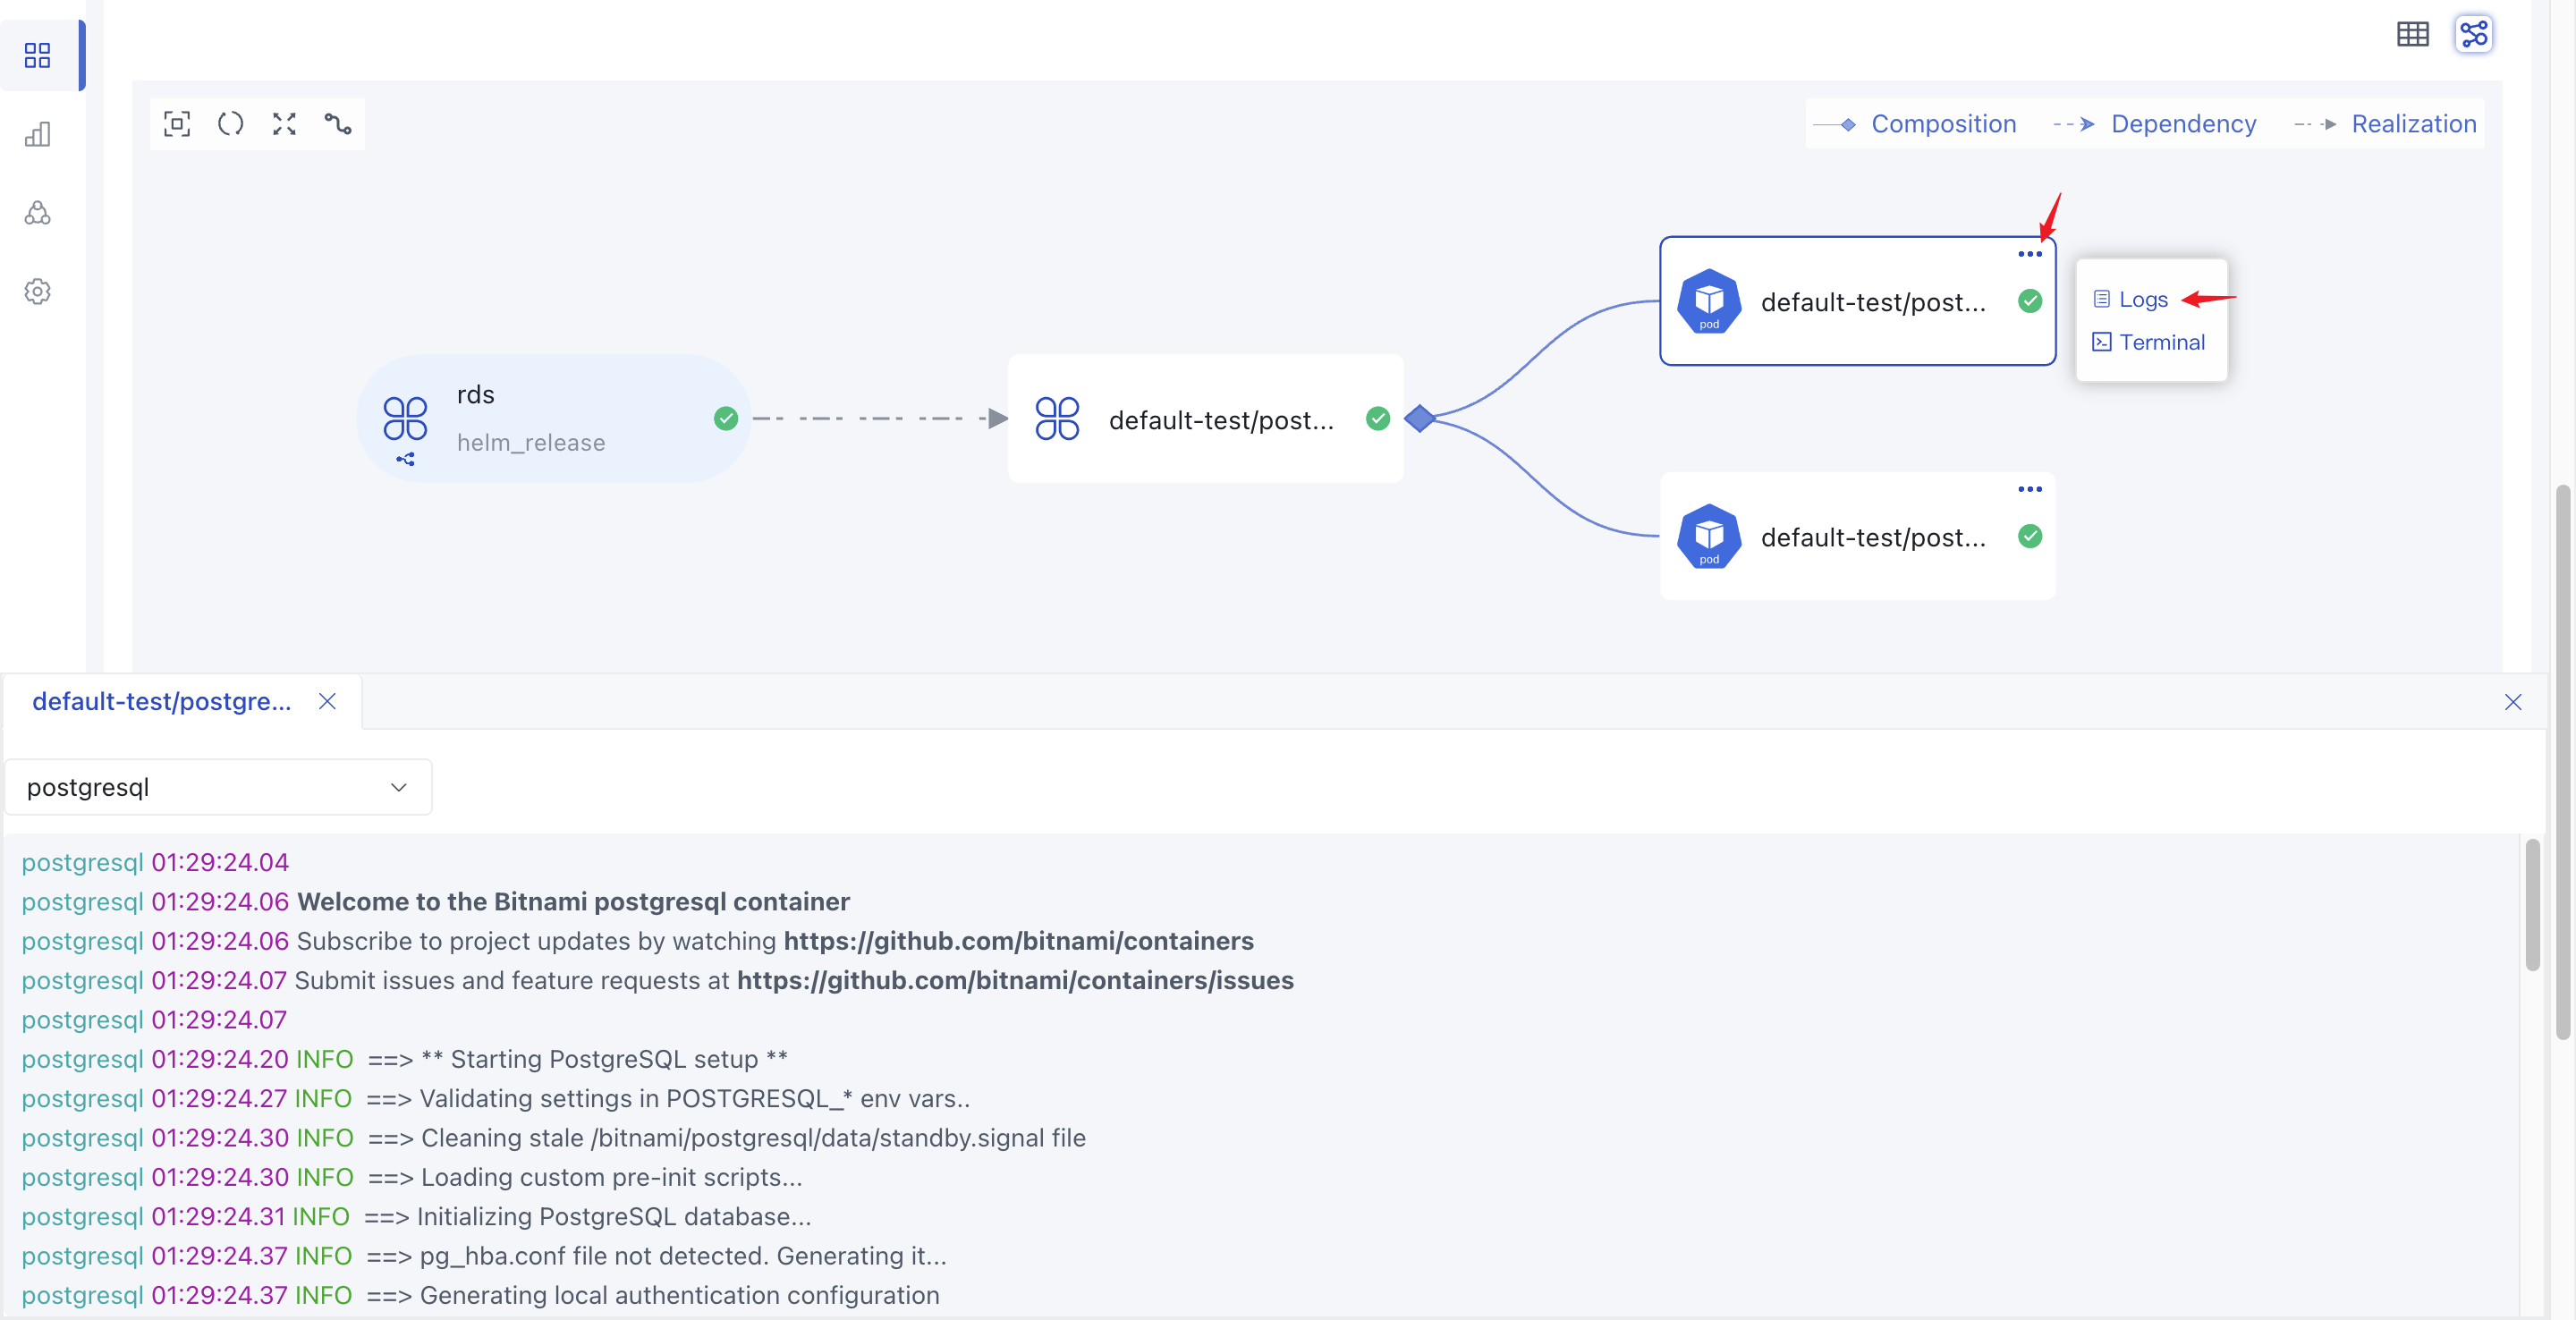
View Component Logs
- In the dependency graph, select a node that can perform log operations, click the icon in the upper left corner of the node square, and then click
Log. - You can adjust the size of the log window as needed by stretching it up and down.
Access Component Terminal
- In the dependency graph, select a node that can perform terminal operations, click the icon in the upper left corner of the node square, and then click
Terminal. - You can adjust the size of the terminal window as needed by stretching it up and down.